February 2011
By: Sarah Hanson, David Knoppers, and Andrew Goga
Introduction
Crucial to contemporary research on global biodiversity and species conservation is the determination of exactly what species exist in particular habitats. Population sizes, fluctuations in these sizes across space and time, and reasons for these fluctuations are of the utmost importance. Integrated with these considerations is the problem of global climate change; though specifics may prove elusive, scientific consensus is that alterations in climate over the current century will substantially change and threaten global patterns of biodiversity (Beier et al. 2009; Butchart et al. 2010). Broad-scale models of biodiversity based on indicators such as latitude, mean annual rainfall, and net primary productivity have proven useful for estimating general species richness in the landscape in question (Gaston 2000). However, those models are far from a state of robustness in which they effectively replace or supplant local or even regional surveys of species richness. In fact, recent scholarship in ecology and biogeography explicitly promotes local-scale investigation of topography, geology, and plant biodiversity for the purposes of flora and fauna biodiversity conservation (Beier et al. 2009), and for the improvement of generalized models and understandings of biodiversity indicators across scales (Gaston 2000; Cumming et al. 2010).
The Dwesa-Cwebe Nature Reserve, situated in the Transkei Coastal Belt of the Eastern Cape Province in South Africa, is a vital conservation area for a variety of regional flora and fauna (Strelitzia 2006). The geology, climate characteristics, topography, and to a limited extent, species diversity, are understood and documented (Strelitzia 2006). However, data is limited on exactly what plant species, particularly tree species, are growing where and in what numbers. Given the established importance of this information to various fields of scholarship and to conservation goals within the reserve area, as well as the potential of such data to serve as a starting point from which to track changes in species abundance over space and time, we have procured and assembled data on tree biodiversity and abundance in the Dwesa-Cwebe Nature Reserve. Descriptions of our research methods and results, as well as a critical evaluation of our findings, usefulness, and generalizability, constitute this report.
Methods
For this report, three 40-by-40-meter forest plots in the Dwesa-Cwebe Nature Reserve were surveyed, tallied and analyzed by a team of undergraduate students and faculty from the Pennsylvania State University with training and background in a variety of disciplines. The three plots are as follows: Cwebe Web, Cwebe Dune, and Dwesa Ivory. The Cwebe Dune plot was surveyed in February of 2010, and the other two plots were surveyed in February of 2011 by a mostly different group of undergraduates. Prior to surveying the plots, students attended lectures on conservation management, biology, botany, and plant identification taught by various biological science professors from Penn State and Rhodes University, as well as members of the Eastern Cape Parks Board. Students from the 2011 group were exposed to a day-long experiential course in plant specimen identification at the Conservation Academy in
Grahamstown, under the supervision of Ph.D. botanist Wayne Vos. The 2011 group gained some experience in demarcating and surveying tree species during an eight-day trip to the Mkambati Nature Reserve before establishing the recent plot in Dwesa.
With the help of the Eastern Cape Parks Board, three plots were chosen to best sample the biodiversity present in each specific area. Both the Cwebe Web Plot and the Dwesa Ivory Plot are situated within a type of vegetation called Coastal Scarp Forest, often an intermediate zone between the Afromontaine Forest and the Dune Thicket biomes. The Cwebe Dune Plot lies in a Coastal Dune Thicket. Each square plot was demarcated with orange flagging, and each tree measuring more than 13.1 centimeters in circumference (about 5 cm DBH) was labeled using a metal numbered tag. In conjunction with this study on the biodiversity of tree species, research on forest biomass is also underway for the same plots of forest. Because the storage capacity of carbon is being analyzed, tagging individual trees of a lesser circumference and DBH (diameter at breast height) would prove impractical; therefore, smaller trees are excluded in this data. In addition, not all trees have been identified due to limited time, knowledge, and resources. Unknown species, which comprise a small minority of this data, were excluded from this analysis. These unknown factors do leave room for error; this is addressed in our discussion.
In the Cwebe Web Plot, students from the 2010 group laid the boundaries and tagged the trees. Thus, 2011 students had only to identify the tree species present in the plot. A Cwebe community member named Vasco Juju, along with three forestry workers, assisted the students in identifying tree species, particularly by providing Xhosa names for trees. Literature on the plant species present in the Eastern Cape was then used to locate the common and scientific names for each Xhosa name (Von Gadow 1977). Many of the trees in the Cwebe Web Plot were identified by students rather than by professionals, so room for error does exist. Enough confidence exists in order to proceed with analysis, although further re-examinations would certainly benefit this study.
The Cwebe Dune Plot was also established by students in 2010, but the 2011 students never visited the site. Therefore, we have no firsthand information regarding the species there, and the limited information which we do have was left to us by those students. Thus, while we value their classification abilities, we feel slightly more confident analyzing the Cwebe Dune Plot and the Dwesa Ivory Plot, where we personally participated in the surveying process.
At Dwesa, the 2011 students laid the boundaries of the plot and tagged the trees, a process which they mastered at the Mkambati Nature Reserve. Once each tree was tagged in the Dwesa Ivory Plot, they identified each individual tree using the experience and knowledge of various members of the Eastern Cape Parks Board and faculty members from Rhodes University. The Parks Board assistance was provided by two field rangers by the names of Jackson and Ronnie, as well as by Jan Venter. These individuals spend a great deal of time at the reserve and know the species in the area well. The experienced and knowledgeable Rhodes faculty on the trip to Dwesa were Tony Dold, Craig Peter, Brad Ripley, and Roy Lubke, all with extensive formal and informal training in botany. Tony Dold is a well established taxonomist who works as a herbarium coordinator at the Selmar Schoriland Herbarium at Rhodes University. At the botany field camp in February 2011, he instructed students from both universities how to collect and press plant specimens. Brad Ripley is an ecophysiologist and primarily studies grasses, while Craig Ripley primarily studies pollination. Roy Lubke has over three decades of experience studying and publishing pieces on the ecology and the management of coastal areas. Each individual was tremendously helpful in identifying tree species by their common names as we documented tree biodiversity in the Dwesa Ivory Plot. Following the field camp, we utilized a number of printed resources to learn more about the trees’ common names, Xhosa names, scientific names, and descriptions (Boon 2010; Thomas 2004; Von Gadow 1977).
Results
Nineteen tree species were identified in the Cwebe Web Plot. The five most prevalent species in the plot were the Umzimbeet, Sneezewood, Stink Ebony, Common Spikethorn, and Bush Willow trees. Respectively, they comprised 15, 14, 12, 11, and 9 percent of the total population of identified trees in the plot. Figure 1.1 contains a full record of our findings.
The Cwebe Dune Plot contains significantly less tree biodiversity in comparison to the other surveyed plots. In fact, only six species were identified, and this shortage may be a result of inadequate identification on the parts of the students last year. The most prevalent species in the plot were the Coast Red Milkwood, the White Milkwood, the Small-Leaved Yellowwood, and the Boxwood. Respectively, they comprised 40, 33, 12, and 9 percent of the total population of identified trees in the plot. Figure 1.2 contains a full record of our findings. Eighteen tree species were identified in the Dwesa Ivory Plot. The five most prevalent species in the plot were the Boxwood, Stink Ebony, Blue Bitterberry, Hairy Flat Bean, and Cape Onionwood. Respectively, they comprised 28, 22, 18, 8, and 5 percent of the total population of identified trees in the plot. Figure 1.3 contains a full record of our findings. Only seven tree species were found in both Cwebe Web and Dwesa Ivory, despite the fact they are both examples of Coastal Scarp Forests. The Boxwood tree was found in all three plots, including the Coastal Dune Thicket of Cwebe Dune.
Discussion
The question of generalizability arises when three 40-by-40-meter plots from two different biomes are used to describe species abundance and diversity in a nature reserve that is approximately 152.54 square kilometers in area (Hayward et al. 2005). What can first be said is that the data we are presenting is robust; an abundance of identifications and characteristics were recorded in the field, and this information has been weighed against existing scientific literature on tree species in the region (Boone 2010) and discussed with local experts where possible. Previous studies suggest that despite our fairly small study areas, our samples represent over 50 percent of tree species diversity in their relevant biomes (Gaston 2000). Furthermore, the data collected by Rhodes University botany students and professors will provide a thorough perspective on the range of tree and plant species in Dwesa; our plots provide insight into exactly how many of each species is occurring in a given portion of the reserve.
An unfortunate limitation of our data collection is that only a small fraction of the researchers involved are formally trained as botanists or otherwise hail from a relevant field of biological science. All persons involved in data collection had multiple opportunities to gain some level of expertise in field botany, species identification, and biological sciences as discussed in the methods section, but this is not a replacement for years or decades of formal training and experience. Despite our best efforts to record and evaluate the data as thoroughly as possible, there is some margin of error at hand that must be remembered when evaluating our results.
It would be useful in this regard to return to the plots we surveyed with a group of more appropriately trained people to identify species we could not and verify the identifications we made. It would also clearly be useful to create and survey more plots in the reserve and in other relevant biomes of the Transkei Coastal Belt.
We are also limited by narrow time constraints when it comes to analyzing our results and using it to contribute to the fields of research and science discussed in the introduction. It will fall upon future researchers to perform more comprehensive analyses based upon our data and that of others to make those contributions. A few prominent examples exist. It was established in the introduction that broad-scale models of biodiversity estimation are often used by scientists, researchers, and policymakers to calibrate conservation goals and policies. Much could be learned if our information on tree species counts and abundance was weighed against what various models would predict for our study areas based on different indicators.
Beier et al. 2009 and others have made the persuasive argument that a key to biodiversity conservation is to identify and preserve sections of land fulfilling certain geological, topographical, and floristic criteria. Those sympathetic to this argument will be grateful that this report provides most of the pertinent information for two major biomes of the Transkei Coastal Belt, an internationally significant hotspot of biodiversity. Finally, this data will serve as a starting point for those interested in tracking and examining changes in flora abundance and diversity in the reserve, especially given that such changes are predicted to be accelerated and exacerbated as a function of climate change (Rutherford et al. 1999).
Conclusion
In biodiversity conservation at any scale, knowing is half the battle, and we have made a significant contribution to knowledge of tree species abundance and diversity in important biomes of an important ecological region of the world. The information provided in this report is not an end unto itself. It is a starting point. We have discussed and illustrated future research directions based on the progress made here. We hope that future researchers and students take up the challenge of completing the ecological picture of the Eastern Cape and applying its lessons to other fields of research wherever useful. In biodiversity conservation at any scale, knowing is half the battle, and we have made a significant contribution to knowledge of tree species abundance and diversity in important biomes of an important ecological region of the world. The information provided in this report is not an end unto itself. It is a starting point. We have discussed and illustrated future research directions based on the progress made here. We hope that future researchers and students take up the challenge of completing the ecological picture of the Eastern Cape and applying its lessons to other fields of research wherever useful.
Figures
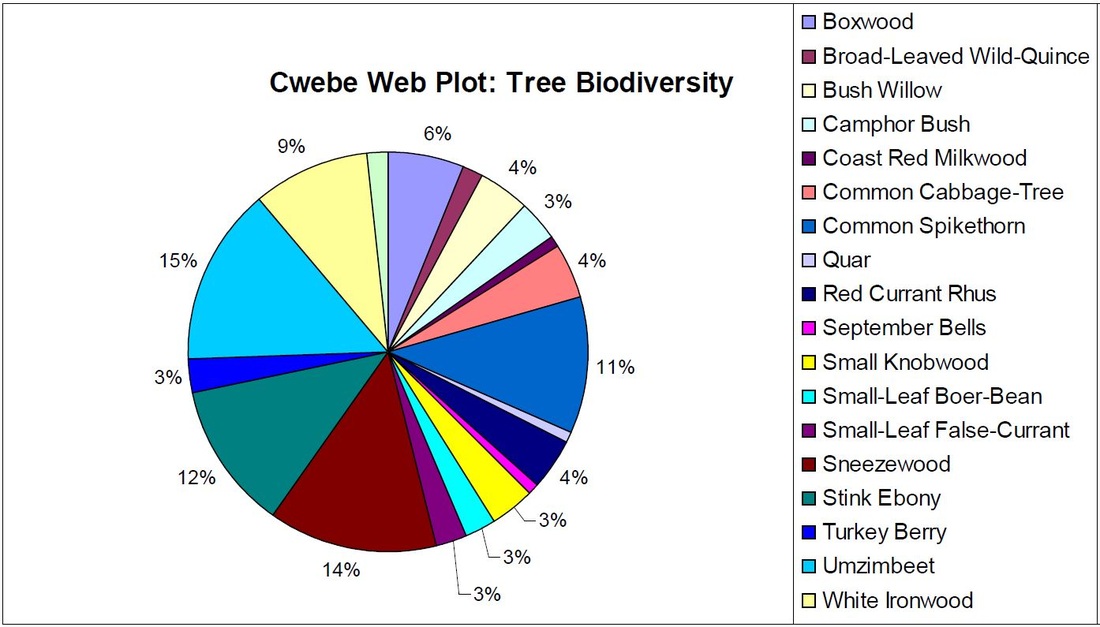
Figure 1.1 – Cwebe Web Plot: Tree Biodiversity
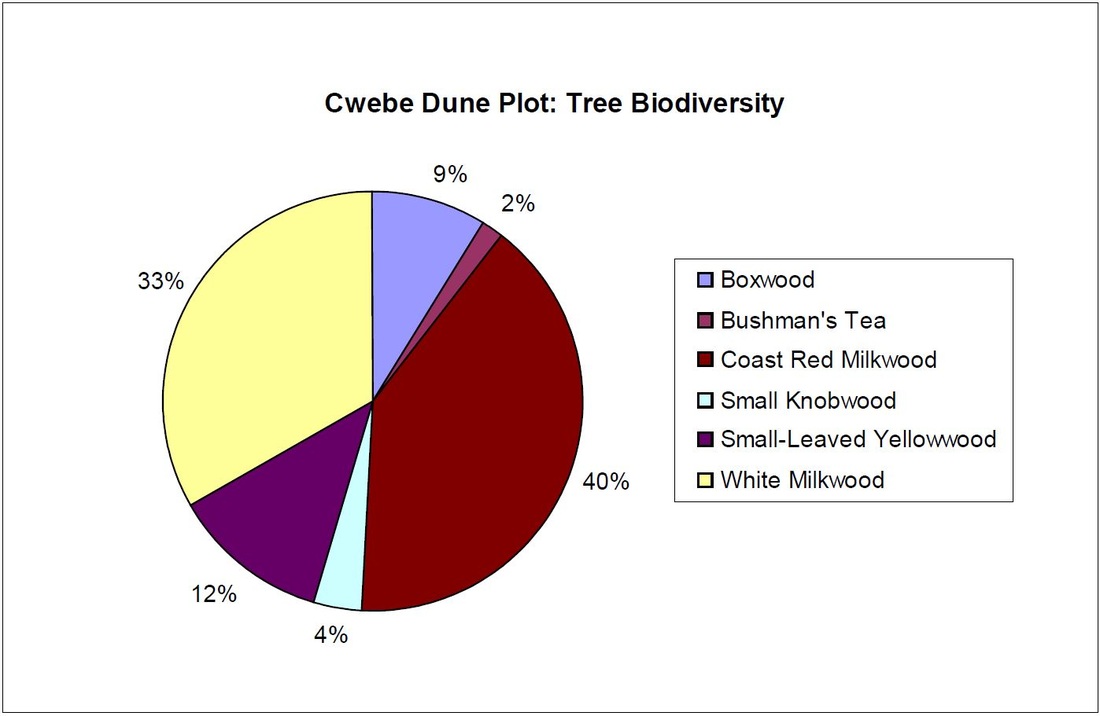
Figure 1.2 – Cwebe Dune Plot: Tree Biodiversity
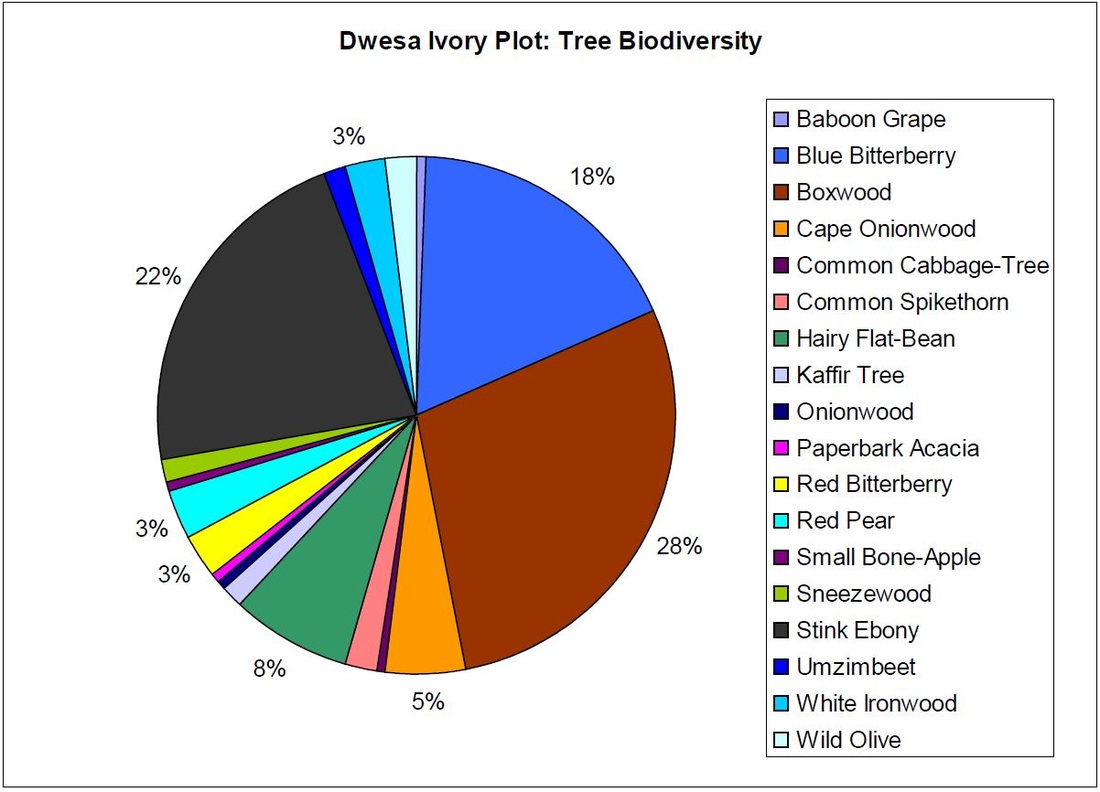
Figure 1.3 – Dwesa Ivory Plot: Tree Biodiversity
References
Beier, P. & Brost, B. 2010. Use of Land Facets to Plan for Climate Change: Conserving the Arenas, Not the Actors. Conservation Biology, 24(3): 701-710.
Boon, R. 2010. Pooley's Trees of Eastern South Africa: A Complete Guide. Durban: Flora & Fauna Publications Trust.
Butchart, S., et al. 2010. Global Biodiversity: Indicators of Recent Declines. Science, 328: 11641168.
Chan, K., et al. 2007. When Agendas Collide: Human Welfare and Biological Conservation. Conservation Biology, 21(1): 59-68.
Cumming, G., et al. 2010. Network Analysis in Conservation Biogeography: Challenges and Opportunities. Diversity and Distributions, 16: 414-425.
Du Toit, J. 2010. Considerations of Scale in Biodiversity Conservation. Animal Conservation, 13: 229-236.
Gaston, K. 2000. Global Patterns in Biodiversity. Nature, 405: 220-226.
Hayward et al. 2005. Mammalian fauna of indigenous forest in the Transkei region of South Africa: an overdue survey. South African Journal of Wildlife Research, 35(2): 117-124.
Rutherford et al. 1999. Climate Change in Conservation Areas of South Africa and Its Potential Impact on Floristic Composition: A First Assessment. Diversity and Distributions, 5(6): 253-262.
Thomas, V. & Grant, R. 2004. Sappi Tree Spotting: KwaZulu-Natal and Eastern Cape. Johannesburg: Jacana Media. Print.
Unknown Author, 2006. Coastal Vegetation of South Africa. Streletzia 19: 580, 602, 603, 689, 690.
Von Gadow, K. 1977. 100 Indigenous Trees of the Eastern Cape Border Region: A Leaf-Key. Department of Forestry: Pamphlet 195. Print.
