04/30/2013
ABSTRACT
Haiti and the Dominican Republic share an island but little more. Their cultures, climates, and economy are night and day, and do not share much in common. Due to the environmental exploitation of natural resources, specifically timber and charcoal, Haiti has lost more than 98 percent of its natural forest cover and its economy relies on the production and sale of firewood. These changes in the landscape within Haiti are visible at a synoptic scale, and are best visualized using remotely sensed imagery. One measure that accurately communicates the loss of forest cover and the deterioration of vegetation health in Haiti is the Normalized Vegetation Index (NDVI) or greenness. In this analysis, I attempt to reveal trends in the greenness both spatially and temporally within Hispaniola. The temporal time frame I am interested in is the present, from 2000 to 2012. The results of my analysis reveal that the surface area covered with high vegetation in Haiti has decreased over the last twelve years, and is consistently lower than the Dominican Republic. On the contrary, the surface area within the Dominican Republic that is highly vegetated has increased over time, as has the square acres of protected areas.
1. Introduction
Hispaniola, an island in the Caribbean Sea, is located at 19°N 71°W. This island is occupied by two countries, with Haiti occupying the western one-third of the island, and the Dominican Republic occupying the eastern two-thirds. The climate in Hispaniola is tropical, but becomes semiarid in the mountainous regions. Although Haiti and the Dominican Republic share the same island, they vary substantially in environmental, social, and political health. The Human Development Index (HDI) is a measure used to rank countries based on various quantitative indicators such as health, education, and living standards to determine their rank in development on a global scale [5]. In the Americas, Haiti has the lowest HDI (2013), followed by Guatemala, Nicaragua, and Honduras [4]. The Dominican Republic, on the other hand, is more advanced than Haiti due to better political and economic conditions. Today the country of Haiti is largely deforested, and less than 2% of the country’s forests remain.
1.1 History
The island of Hispaniola was first claimed by the Spanish in 1492 with the discovery of the island by Spanish explorer Christopher Columbus. By 1655, the French had settled on the island too, but further west than the Spaniards. They soon established the colony, Saint-Dominique, which occupied the area that is now Haiti, and would become the “Pearl of the Antilles”. The colony’s economy was supported by the production of indigo, cotton, sugar, and coffee, all of which required extensive initiatives to clear the forests. Near the end of this prosperous period for Saint- Dominique, there was a revolution initiated by the slaves who worked the plantations. War ensued and Haiti became the first black sovereign nation; however, the French refused to recognize the country’s sovereignty until they paid a substantial debt for “lost property”.
1.2 Environmental Degradation in Haiti
To repay this debt, the Haitian government entered into the timber industry, and proceeded to cut its native hardwood forests until the debt was repaid. This debt was not repaid until 1947 [6]. The need to harvest Haiti’s species diverse hardwood forests stands became the second driver of deforestation and environmental degradation, after the monoculture which required the clearing of forests. Deforestation in Haiti is a key driver of environmental and social degradation, for the loss of forest cover increases occurrences of flooding and erosion since there are no roots in the soil to absorb the precipitation. Current causes of deforestation include slash-and-burn agricultural practices and more importantly, the production of charcoal. More than 95% percent of the 10 million residents in Haiti rely on charcoal and fuel wood for their cooking needs, and 71% of the country’s total energy consumption is derived from charcoal and fuel wood [7]. Because of this high demand for charcoal, hundreds of people are able to derive a livelihood from the production or sale of charcoal. An image of charcoal being sold at a market in Port au Prince, Haiti is shown in (Image 3). The countries extreme level of distress and degree of poverty makes conservation initiatives in Haiti complex, because the forests are one of the only sources of income for many.
1.3 NDVI in Hispaniola
One study undertaken by researchers at Indiana University used a combination of Landsat TM and ETM+ and Advanced Very High Resolution Radiometer (AVHRR) imagery over a 14-year period to investigate variations in NDVI within Hispaniola spatially and temporally. Wilson et al. concluded their analysis by saying that, “average NDVI was consistently higher on the Dominican side (of the Haiti/Dominican Republic border),” and that, “there is also as stronger positive correlation between NDVI, slope, and elevation on the Dominican side” [2, 15]. This finding is not surprising since the Dominican Republic has more forest cover in comparison to Haiti. Authors attributed the low correlation in Haiti to the extensive deforestation because there is a greater likelihood of steeper slopes to be cleared of tree cover from agricultural conversion and / or harvesting of trees for charcoal production. A more intuitive method to compare the two countries, I feel, is to use a rate since the countries differ greatly in size.
Due to the consistent tree cutting in Haiti to support the demand for charcoal, I expect to find the percentage of surface area that is highly vegetated (high NDVI) in Haiti to consistently decrease from year to year and have a much lower percentage of “green” area in comparison to the Dominican Republic. I would also hypothesize that the percentage of “green” surface area in the Dominican Republic would increase over time 2000 to 2012.
2.1 Imagery
Normalized Vegetation Index (NDVI) composite images for the island of Hispaniola are available freely online at the USGS FEWS NET (United States Geological Survey Famine Early Warning Systems Network) data portal (http://earlywarning.usgs.gov/fews/). NDVI in these images was calculated using two bands: one in the visible portion of the electromagnetic spectrum (EMS) and the other in the near infrared. The equation used to calculate NDVI can be seen in (Figure 1), and the spatial resolution of these images is 250 meter (m). Each image I used was a 10-day maximum value composite, which means that the maximum value observed at each point is recorded and included in the final dataset. The technique used to smooth the imagery is the weighted least squares linear regression method. This method is applied to the composite imagery to account for errors due to cloud interference and other atmospheric contamination. One assumption in this approach to atmospheric correction is that the standard deviation for each error term is constant over each data point, or pixel in our case. This of course is not always a viable assumption as some areas account for less error than others. However, because my study area is in the tropics, temporally smoothed composite images are necessary to create a product that is cloud-free.
The sensor used to collect the data used to make the composite images is aboard the Terra satellite, and is called the Moderate-resolution Imaging Spectroradiometer (MODIS). This sensor is an active sensor, and doubles as both an emitter and receiver of radiation at different wavelengths. This sensor is particularly advantageous for climate studies, because it is able to sense in a range of wavelengths varying from the visible to the microwave portions of the EMS (0.4 µm- 14.4 µm). The characteristic of the sensor allows MODIS to be used to sense many climate variables included ocean color, atmospheric water vapor, cloud top temperatures, surface temperatures over sea and land, ozone and aerosols in the atmosphere, and vegetation properties. A table summarizing my data is shown in (Table 1). Each of these variables is sensed at different resolutions, but the NDVI images I have are at the maximum resolution possible for this sensor because it is interpolated using shorter wavelengths.
2.2 Methods of Analysis
To investigate the change in surface cover of highly photosynthesizing vegetation, or “green areas” within Haiti and the Dominican Republic, I downloaded 10-day composite images of NDVI in Hispaniola dating back to the year 2000. An example of a composite image from December 2001 is shown in (Image 1). I was interested in including insight into inter-seasonal variations, too, so I selected three images for each year. One was in the wet season, December 1st through the 10th, the other in the dry, from April 1st to the tenth. In addition, I included an NDVI image during the hurricane season, from August 1st to the 10th. Each image was taken roughly four months apart from one another, spaced in equal increments throughout a year. The trends in NDVI for each season are shown in (Figures 5-7). In short, I used 36 composite images spaced in equal increments (4 month periods) throughout my 12 year study period. The break values were simple DN values ranging from 0 to 255, rather than NDVI values which range from -1 to 1. This was one disadvantage of my data; because the cell values represented color, I could not compare NDVI values but was limited to look at areas of regions falling within each region of the color scheme used to represent high green, vegetated surfaces versus low green, vegetated surfaces. To differentiate highly vegetated or green surfaces from non-vegetated surfaces, I classified each image into 10 classes using a manual break classification scheme. The break values were the same for each image to maintain uniformity in my calculations. Break values were determined through the experimentation of natural breaks classification scheme and a histogram of the cell values. (Figure 2) shows a small area of Haiti reclassified into the 10 classes. The black arrow simply indicated the class of interest which was the highest green, class 10.
Since my reclassified images were still of Hispaniola, each image was clipped twice to the boundary of each country. The country boundary shapefiles were downloaded from the Geocommons website (http://geocommons.com/overlays/33578). With these country boundaries, I clipped each of my 36 NDVI images twice, once to each boundary. Through viewing the attribute table in my GIS, ArcGIS, the number of pixels within class 10 could be determined. Class 10 included all pixels in the image that was of the highest greenness for that particular image. The number of pixels within class 10 of each of the 72 images was recorded in addition to the total number of pixels occurring over land (classes 2 through 10 as class 1 was water). Recording the total number of pixels over land in the image allowed me to calculate a rate of the highly vegetated, or green, surface area to non-green surface area for each country.
3. Results and Discussion
Figure 3 shows the percent of surface cover in Haiti that is “green” for 36, 10-day periods spanning from 2001 to 2012, and (Figure 4) does the same for the Dominican Republic. A simple, linear trend line was applied to each bar graph to display the overall trend, either increasing in greenness, indicated by a positive slope, or decreasing in greenness, indicated by a negative slope. Over the 12-year time span from 2001 to 2012, Haiti experienced a decrease in NDVI greenness, while the Dominican Republic has seen an increase in overall surface greenness. This trend could be attributed to many causes, which include both social and climatological phenomena.
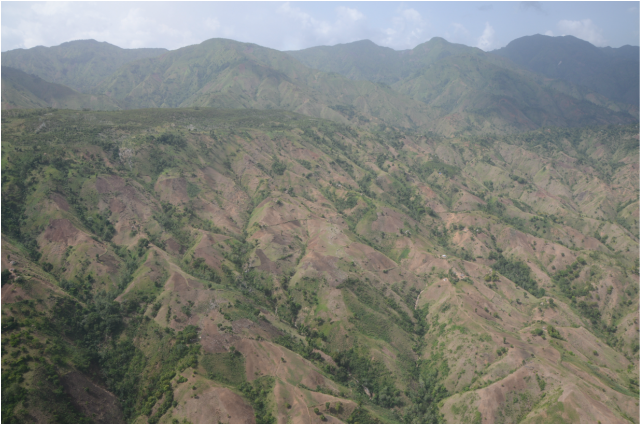
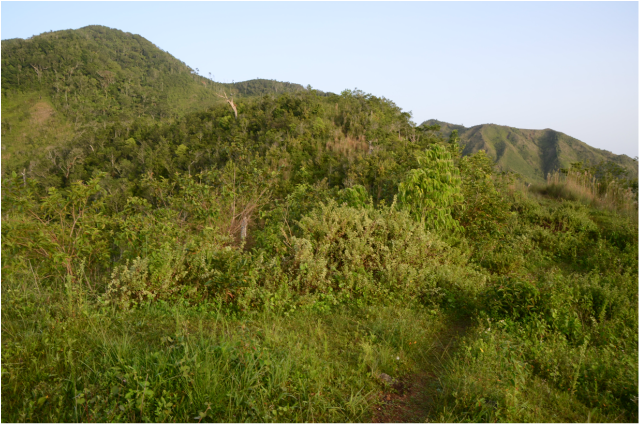
The most apparent social factor that can influence the NDVI of a region, and Haiti in particular, is the cutting of trees. As I mentioned in my introduction, Haiti is nearly entirely deforested, with less than two percent of its forests remaining and 30 to 40 million trees are cut each year. The tree cutting leaves barren hillsides, without trees to photosynthesize. Of course grass and small shrubs photosynthesize, too; however, the high green areas I am quantifying in this analysis are of trees in particular. I can tell this by comparing the areas I’ve selected and viewing the land cover type on the ground using Landsat TM imagery and Google Maps. Less than 4 percent of Haiti’s surface area protected and estimates are that the actual area of physically protected area (area a person cannot harvest firewood from) is much less. Due to a lack of resources, harvesting still occurs within all of the parks borders. (Image 4) shows two pictures, one of a hillside in Haiti and the other a hillside in the Dominican Republic. You can imagine that the image taken in the Dominican Republic would yield a much higher NDVI value than the one in Haiti since photosynthetic vegetation like trees is highly reflective in the red portion of the EMS (0.62 µm-0.75 µm) and NDVI is a ratio of red to infrared reflectances. Deforestation in Haiti is a problem that has been recognized for decades, and action is being taken at the policy level to remedy this ecological disaster. The president of Haiti has initiated the first national tree-planting program, to being in May 2013. Under this program, more than 1.2 million trees are to be planted, but “only when the rules of tree planting and access to land are clearly understood” by the people of Haiti, a program can succeed, says ecologist Joel Timyan [3].
The greatest climatological factor that influences NDVI and tree growth in particular is change. Feeley et al. found that tree growth is decelerating in tropical forest trees, and correlated the decrease in tree growth rates to regional climate change patterns [1]. Of course individual indicators of climate change such as annual mean and maximum temperature and precipitation amounts in addition to the number of days without rain each year would be applicable to NDVI trends, but due to a limited amount of time I was unable to incorporate this into my analysis. I did look at trends in NDVI within each country during April, August, and December (Figures 5-7). These are probably more directly related to precipitation, temperature, and things such as hurricanes, El Nino and La Nina events, and drought.
4. Summary and Conclusions.
This analysis reveals the differences both spatially within Hispaniola, and temporally, within both Haiti and the Dominican Republic. Further analyses incorporating specific climatologic variables such as temperature and precipitation could introduce a causal relationship between the trends that I have identified in my analysis, although I have already attributed the trends to forest cover patterns and socio-ecological relationships between humans and the environment. Understanding trends in vegetation health is important for understanding global carbon cycling relationships and also biodiversity, as the Caribbean has some of the highest biodiversity but contains less than one percent of the world’s forests.
Figures, Tables, and Graphs
Haiti and the Dominican Republic share an island but little more. Their cultures, climates, and economy are night and day, and do not share much in common. Due to the environmental exploitation of natural resources, specifically timber and charcoal, Haiti has lost more than 98 percent of its natural forest cover and its economy relies on the production and sale of firewood. These changes in the landscape within Haiti are visible at a synoptic scale, and are best visualized using remotely sensed imagery. One measure that accurately communicates the loss of forest cover and the deterioration of vegetation health in Haiti is the Normalized Vegetation Index (NDVI) or greenness. In this analysis, I attempt to reveal trends in the greenness both spatially and temporally within Hispaniola. The temporal time frame I am interested in is the present, from 2000 to 2012. The results of my analysis reveal that the surface area covered with high vegetation in Haiti has decreased over the last twelve years, and is consistently lower than the Dominican Republic. On the contrary, the surface area within the Dominican Republic that is highly vegetated has increased over time, as has the square acres of protected areas.
1. Introduction
Hispaniola, an island in the Caribbean Sea, is located at 19°N 71°W. This island is occupied by two countries, with Haiti occupying the western one-third of the island, and the Dominican Republic occupying the eastern two-thirds. The climate in Hispaniola is tropical, but becomes semiarid in the mountainous regions. Although Haiti and the Dominican Republic share the same island, they vary substantially in environmental, social, and political health. The Human Development Index (HDI) is a measure used to rank countries based on various quantitative indicators such as health, education, and living standards to determine their rank in development on a global scale [5]. In the Americas, Haiti has the lowest HDI (2013), followed by Guatemala, Nicaragua, and Honduras [4]. The Dominican Republic, on the other hand, is more advanced than Haiti due to better political and economic conditions. Today the country of Haiti is largely deforested, and less than 2% of the country’s forests remain.
1.1 History
The island of Hispaniola was first claimed by the Spanish in 1492 with the discovery of the island by Spanish explorer Christopher Columbus. By 1655, the French had settled on the island too, but further west than the Spaniards. They soon established the colony, Saint-Dominique, which occupied the area that is now Haiti, and would become the “Pearl of the Antilles”. The colony’s economy was supported by the production of indigo, cotton, sugar, and coffee, all of which required extensive initiatives to clear the forests. Near the end of this prosperous period for Saint- Dominique, there was a revolution initiated by the slaves who worked the plantations. War ensued and Haiti became the first black sovereign nation; however, the French refused to recognize the country’s sovereignty until they paid a substantial debt for “lost property”.
1.2 Environmental Degradation in Haiti
To repay this debt, the Haitian government entered into the timber industry, and proceeded to cut its native hardwood forests until the debt was repaid. This debt was not repaid until 1947 [6]. The need to harvest Haiti’s species diverse hardwood forests stands became the second driver of deforestation and environmental degradation, after the monoculture which required the clearing of forests. Deforestation in Haiti is a key driver of environmental and social degradation, for the loss of forest cover increases occurrences of flooding and erosion since there are no roots in the soil to absorb the precipitation. Current causes of deforestation include slash-and-burn agricultural practices and more importantly, the production of charcoal. More than 95% percent of the 10 million residents in Haiti rely on charcoal and fuel wood for their cooking needs, and 71% of the country’s total energy consumption is derived from charcoal and fuel wood [7]. Because of this high demand for charcoal, hundreds of people are able to derive a livelihood from the production or sale of charcoal. An image of charcoal being sold at a market in Port au Prince, Haiti is shown in (Image 3). The countries extreme level of distress and degree of poverty makes conservation initiatives in Haiti complex, because the forests are one of the only sources of income for many.
1.3 NDVI in Hispaniola
One study undertaken by researchers at Indiana University used a combination of Landsat TM and ETM+ and Advanced Very High Resolution Radiometer (AVHRR) imagery over a 14-year period to investigate variations in NDVI within Hispaniola spatially and temporally. Wilson et al. concluded their analysis by saying that, “average NDVI was consistently higher on the Dominican side (of the Haiti/Dominican Republic border),” and that, “there is also as stronger positive correlation between NDVI, slope, and elevation on the Dominican side” [2, 15]. This finding is not surprising since the Dominican Republic has more forest cover in comparison to Haiti. Authors attributed the low correlation in Haiti to the extensive deforestation because there is a greater likelihood of steeper slopes to be cleared of tree cover from agricultural conversion and / or harvesting of trees for charcoal production. A more intuitive method to compare the two countries, I feel, is to use a rate since the countries differ greatly in size.
Due to the consistent tree cutting in Haiti to support the demand for charcoal, I expect to find the percentage of surface area that is highly vegetated (high NDVI) in Haiti to consistently decrease from year to year and have a much lower percentage of “green” area in comparison to the Dominican Republic. I would also hypothesize that the percentage of “green” surface area in the Dominican Republic would increase over time 2000 to 2012.
2.1 Imagery
Normalized Vegetation Index (NDVI) composite images for the island of Hispaniola are available freely online at the USGS FEWS NET (United States Geological Survey Famine Early Warning Systems Network) data portal (http://earlywarning.usgs.gov/fews/). NDVI in these images was calculated using two bands: one in the visible portion of the electromagnetic spectrum (EMS) and the other in the near infrared. The equation used to calculate NDVI can be seen in (Figure 1), and the spatial resolution of these images is 250 meter (m). Each image I used was a 10-day maximum value composite, which means that the maximum value observed at each point is recorded and included in the final dataset. The technique used to smooth the imagery is the weighted least squares linear regression method. This method is applied to the composite imagery to account for errors due to cloud interference and other atmospheric contamination. One assumption in this approach to atmospheric correction is that the standard deviation for each error term is constant over each data point, or pixel in our case. This of course is not always a viable assumption as some areas account for less error than others. However, because my study area is in the tropics, temporally smoothed composite images are necessary to create a product that is cloud-free.
The sensor used to collect the data used to make the composite images is aboard the Terra satellite, and is called the Moderate-resolution Imaging Spectroradiometer (MODIS). This sensor is an active sensor, and doubles as both an emitter and receiver of radiation at different wavelengths. This sensor is particularly advantageous for climate studies, because it is able to sense in a range of wavelengths varying from the visible to the microwave portions of the EMS (0.4 µm- 14.4 µm). The characteristic of the sensor allows MODIS to be used to sense many climate variables included ocean color, atmospheric water vapor, cloud top temperatures, surface temperatures over sea and land, ozone and aerosols in the atmosphere, and vegetation properties. A table summarizing my data is shown in (Table 1). Each of these variables is sensed at different resolutions, but the NDVI images I have are at the maximum resolution possible for this sensor because it is interpolated using shorter wavelengths.
2.2 Methods of Analysis
To investigate the change in surface cover of highly photosynthesizing vegetation, or “green areas” within Haiti and the Dominican Republic, I downloaded 10-day composite images of NDVI in Hispaniola dating back to the year 2000. An example of a composite image from December 2001 is shown in (Image 1). I was interested in including insight into inter-seasonal variations, too, so I selected three images for each year. One was in the wet season, December 1st through the 10th, the other in the dry, from April 1st to the tenth. In addition, I included an NDVI image during the hurricane season, from August 1st to the 10th. Each image was taken roughly four months apart from one another, spaced in equal increments throughout a year. The trends in NDVI for each season are shown in (Figures 5-7). In short, I used 36 composite images spaced in equal increments (4 month periods) throughout my 12 year study period. The break values were simple DN values ranging from 0 to 255, rather than NDVI values which range from -1 to 1. This was one disadvantage of my data; because the cell values represented color, I could not compare NDVI values but was limited to look at areas of regions falling within each region of the color scheme used to represent high green, vegetated surfaces versus low green, vegetated surfaces. To differentiate highly vegetated or green surfaces from non-vegetated surfaces, I classified each image into 10 classes using a manual break classification scheme. The break values were the same for each image to maintain uniformity in my calculations. Break values were determined through the experimentation of natural breaks classification scheme and a histogram of the cell values. (Figure 2) shows a small area of Haiti reclassified into the 10 classes. The black arrow simply indicated the class of interest which was the highest green, class 10.
Since my reclassified images were still of Hispaniola, each image was clipped twice to the boundary of each country. The country boundary shapefiles were downloaded from the Geocommons website (http://geocommons.com/overlays/33578). With these country boundaries, I clipped each of my 36 NDVI images twice, once to each boundary. Through viewing the attribute table in my GIS, ArcGIS, the number of pixels within class 10 could be determined. Class 10 included all pixels in the image that was of the highest greenness for that particular image. The number of pixels within class 10 of each of the 72 images was recorded in addition to the total number of pixels occurring over land (classes 2 through 10 as class 1 was water). Recording the total number of pixels over land in the image allowed me to calculate a rate of the highly vegetated, or green, surface area to non-green surface area for each country.
3. Results and Discussion
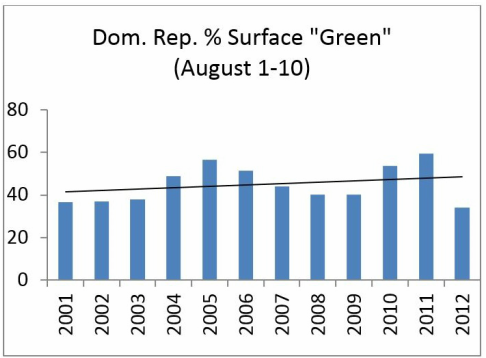
Figure 3 shows the percent of surface cover in Haiti that is “green” for 36, 10-day periods spanning from 2001 to 2012, and (Figure 4) does the same for the Dominican Republic. A simple, linear trend line was applied to each bar graph to display the overall trend, either increasing in greenness, indicated by a positive slope, or decreasing in greenness, indicated by a negative slope. Over the 12-year time span from 2001 to 2012, Haiti experienced a decrease in NDVI greenness, while the Dominican Republic has seen an increase in overall surface greenness. This trend could be attributed to many causes, which include both social and climatological phenomena.
The most apparent social factor that can influence the NDVI of a region, and Haiti in particular, is the cutting of trees. As I mentioned in my introduction, Haiti is nearly entirely deforested, with less than two percent of its forests remaining and 30 to 40 million trees are cut each year. The tree cutting leaves barren hillsides, without trees to photosynthesize. Of course grass and small shrubs photosynthesize, too; however, the high green areas I am quantifying in this analysis are of trees in particular. I can tell this by comparing the areas I’ve selected and viewing the land cover type on the ground using Landsat TM imagery and Google Maps. Less than 4 percent of Haiti’s surface area protected and estimates are that the actual area of physically protected area (area a person cannot harvest firewood from) is much less. Due to a lack of resources, harvesting still occurs within all of the parks borders. (Image 4) shows two pictures, one of a hillside in Haiti and the other a hillside in the Dominican Republic. You can imagine that the image taken in the Dominican Republic would yield a much higher NDVI value than the one in Haiti since photosynthetic vegetation like trees is highly reflective in the red portion of the EMS (0.62 µm-0.75 µm) and NDVI is a ratio of red to infrared reflectances. Deforestation in Haiti is a problem that has been recognized for decades, and action is being taken at the policy level to remedy this ecological disaster. The president of Haiti has initiated the first national tree-planting program, to being in May 2013. Under this program, more than 1.2 million trees are to be planted, but “only when the rules of tree planting and access to land are clearly understood” by the people of Haiti, a program can succeed, says ecologist Joel Timyan [3].
The greatest climatological factor that influences NDVI and tree growth in particular is change. Feeley et al. found that tree growth is decelerating in tropical forest trees, and correlated the decrease in tree growth rates to regional climate change patterns [1]. Of course individual indicators of climate change such as annual mean and maximum temperature and precipitation amounts in addition to the number of days without rain each year would be applicable to NDVI trends, but due to a limited amount of time I was unable to incorporate this into my analysis. I did look at trends in NDVI within each country during April, August, and December (Figures 5-7). These are probably more directly related to precipitation, temperature, and things such as hurricanes, El Nino and La Nina events, and drought.
4. Summary and Conclusions.
This analysis reveals the differences both spatially within Hispaniola, and temporally, within both Haiti and the Dominican Republic. Further analyses incorporating specific climatologic variables such as temperature and precipitation could introduce a causal relationship between the trends that I have identified in my analysis, although I have already attributed the trends to forest cover patterns and socio-ecological relationships between humans and the environment. Understanding trends in vegetation health is important for understanding global carbon cycling relationships and also biodiversity, as the Caribbean has some of the highest biodiversity but contains less than one percent of the world’s forests.
Figures, Tables, and Graphs

Figure 1: Equation used to calculate the Normalized Difference Vegetation Index (NDVI).

Figure 2: Table showing area in m2 of forest cover in the Dominican Republic and Haiti (2000 – 2010).

Figure 3: Graph showing percent surface cover of Haiti which is highly vegetated from April 2001 to December 2012.

Figure 4: Graph showing percent surface cover of the Dominican Rep. which is highly vegetated from April 2001 to December 2012.

|
|
Figure 5: Percent surface cover in Haiti (left) and the Dominican Republic (right) during the first 10 days in April from 2001-2012.
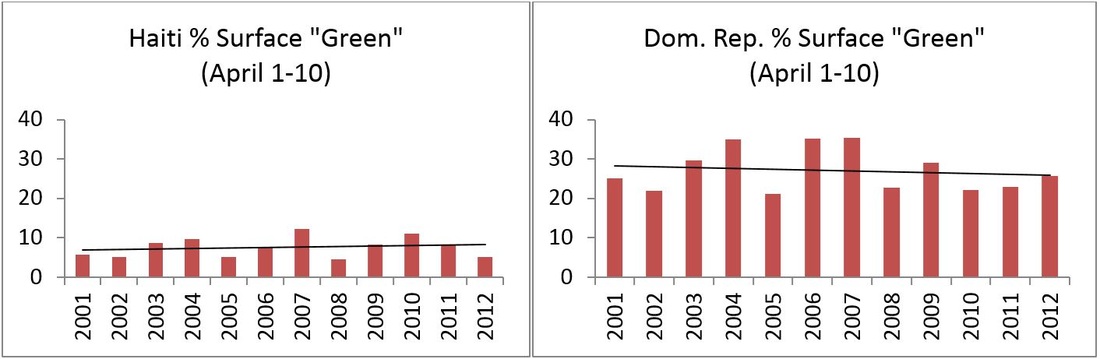
Figure 6: Percent surface cover in Haiti (left) and the Dominican Republic (right) during the first 10 days in August from 2001-2012.
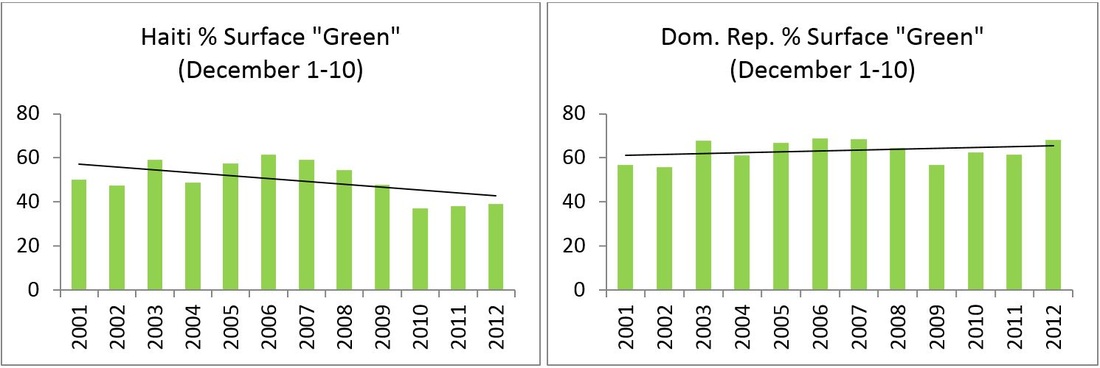
Figure 7: Percent surface cover in Haiti (left) and the Dominican Republic (right) during the first 10 days in December from 2001-2012.
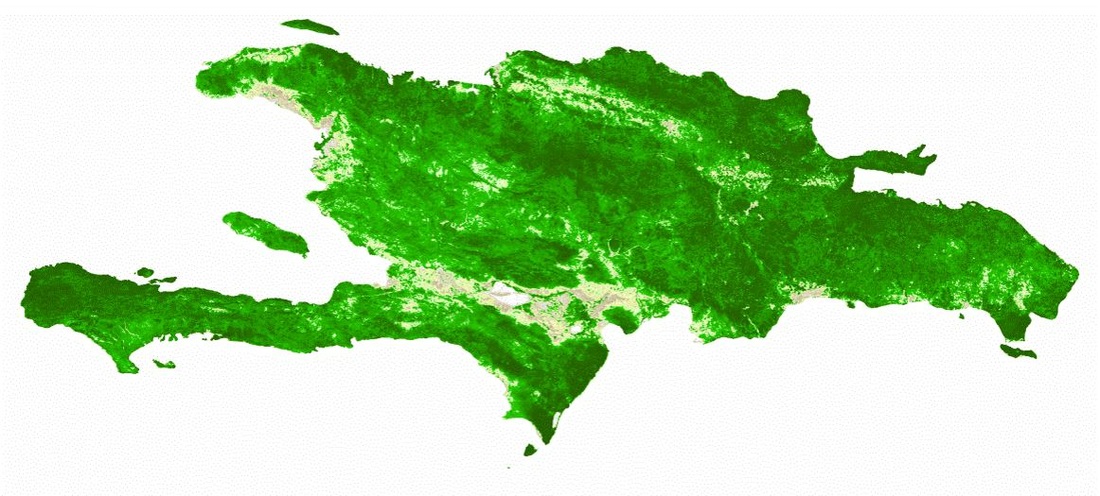
Image 1: One of 36 NDVI 10- day composite images of Hispaniola used for this analysis.

Image 2: A small region of Haiti, with the reclassified portion shown on the left. The yellow areas are in class 10 and have the highest NDVI values.
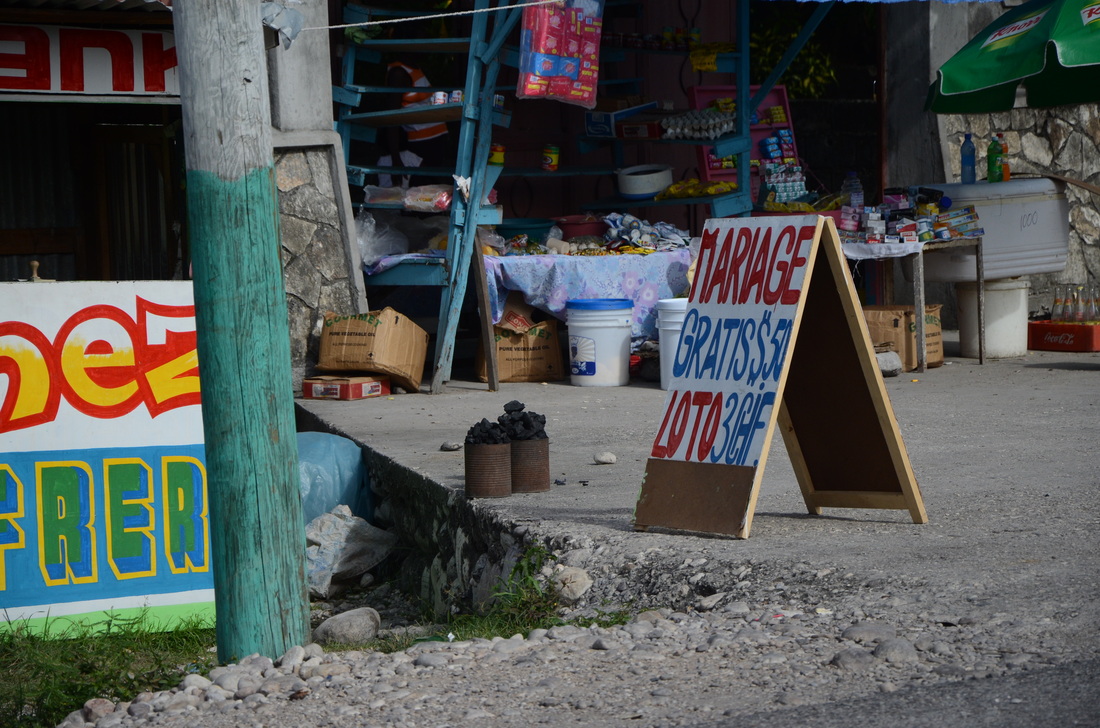
Image 3: Charcoal being sold roadside.
|
|
Image 4: Left: Deforested mountains of the Tiburon Peninsula in Haiti. Right: Forested mountain peak: Morne Grand Bois, also in Haiti.
REFERENCES
[1] Feeley, K. J., S. J. Wright, N. Supardi, A. R. Kassim, and S. J. Davies. 2007. Decelerating growth in tropical forest trees. Ecology Letters 10: 461-469.
[2] Jeffrey S. Wilson , Timothy S. Brothers & Eugenio J. Marcano (2001): Remote Sensing of Spatial and Temporal Vegetation Dynamics in Hispaniola: A Comparison of Haiti and the Dominican Republic, Geocarto International, 16:2, 7-18.
[3] Lall, Rashmee Roshan. "Haiti Aiming to Plant 1.2 Million Trees in a Single Day." Yahoo! News. Yahoo!, 29 Apr. 2013. Web. 29 Apr. 2013.
[4] "The 2013 Human Development Report – "The Rise of the South: Human Progress in a Diverse World"". HDRO (Human Development Report Office) United Nations Development Programme. pp. 144–147. Retrieved 24 April 2013.
[5] United Nations Development Programme. The Human Development Report. 1990. In U.N. Development Programme. The Human Development Report. New York: UNDP, 1999.
[6] von Tunzelmann, Alex. “Haiti the land where children eat mud”. The Sunday Times. London: Times, 17 May 2009.
[7] "2009 Energy Balance for Haiti." IEA Energy Statistics. International Energy Agency, n.d. Web. 25 Apr. 2013.
