Introduction
In this analysis, crime data is being analyzed in reference to the Wine & Spirit liquor store locations in Philadelphia County, PA. In particular, we are interested in determining if crime occurs at a higher frequency near the popular chain. Crimes of all types, as listed in the Philadelphia Police Crime Incidents spreadsheet were compared in areas less than a half mile, between a half mile and one mile, and greater than one mile from a Wine & Spirit store location.
Methods
Data required to complete this spatial inquiry included the locations of Wine & Spirit stores, crime data, and the street centerline shapefile for Philadelphia County, PA. The Philadelphia Police Part One Crime Incidents data includes aggravated assaults, burglary, homicide, motor vehicle theft, recovered stolen motor vehicle, rape, robbery, and theft, and was up to date as of November 18, 2014. Because most crime incidents include an X, Y coordinate pair, marking the location of the crime, crimes were plotted on the map with ease. Records lacking an X, Y coordinate location were deleted (less than 0.007 %). The projection of the crime incident data was a geographic coordinate system, so I reprojected the plotted data to NAD1983 State Plane Pennsylvania South FIPS 3702 Feet (Lambert Conformal Conic), the coordinate system of our other data layers. The Wine & Spirit store locations lacked an X, Y coordinate location and instead had only an address. An Address Locator was created using the Philadelphia Street Centerlines shapefile, which was then used to georeference our text encoded list of Wine & Spirit store locations. The plotted crime data and store locations are shown in Figure 1.
Since the variable of interest here is distance from a store, a Euclidean distance (Spread) function was employed, yielding a raster in which each cell value was representative of the distance (in feet) from the nearest store. The resolution of this raster was 200 feet, and the processing extent was set to the boundaries of Philadelphia County. The raster was then manually reclassified using three classes, 0 to 2640 ft, 2641 – 5280 ft, and 5281 – 10,000 ft, which is shown in Figure 2. In order to select the crime data falling within one of these three classes, I converted my reclassified raster to a polygon vector shapefile, and exported each class as its own shapefile. Using a select by location operation, I selected features from the crime occurrence dataset that intersected each of the three classes and then exported the attribute table after each selection operation to individual text files. The text files were imported into Microsoft Excel, sorted, counted, and used to make the graphs shown in Figures 3 – 5.
Results
Crimes of all types occur less frequently in areas that are more than 1 mile from a Wine & Spirit store location (colored in red in Figure 2), but between the two other classes, it depended on the crime. Homicides occur most frequently between ½ mile and 1 mile of a Wine & Spirit store location, while thefts occur at the highest frequency within ½ mile from a Wine & Spirit store location.
Conclusion
The high incident of theft occurring within a half mile of a Wine & Spirit store location could be attributed to the store presence; however, I find it unlikely that crimes of homicides, rapes, vehicle theft, and other crimes can be attributed to a chain store selling alcohol. Even the high rate of theft occurring near Wine & Spirit stores may be attributed to other factors such as population density. This analysis is also working on the assumption that crime is being reported. Crimes of certain types, such as rape, sometimes fail to be reported. This analysis could be improved by taking population density into account, so that a rate of crime occurrence in each of our three areas could be compared rather than the raw number. It might also be interesting to take a look at thefts occurring Monday through Saturday, compared to Sunday, considering Wine & Spirit stores are closed on this day.
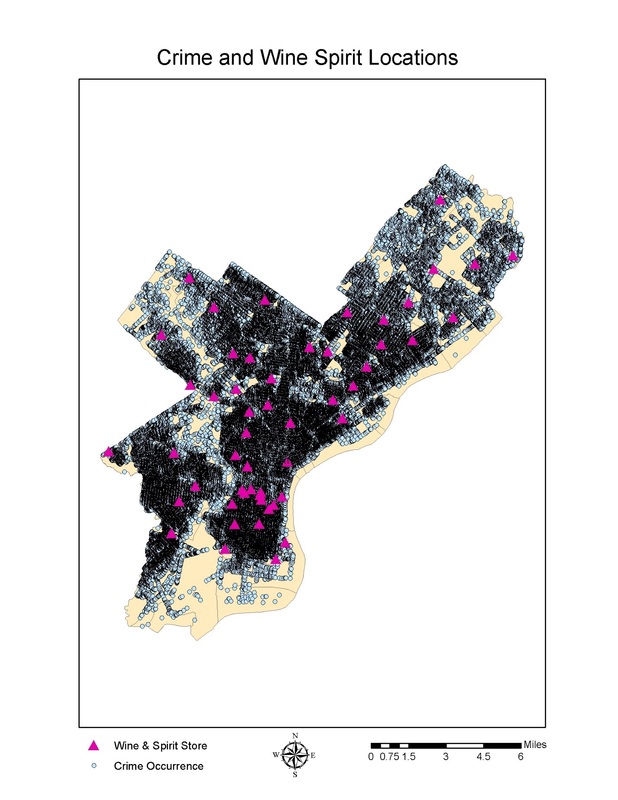
Figure 1. A map showing the georeferenced Wine & Spirit store locations and the locations of crime in Philadelphia County.
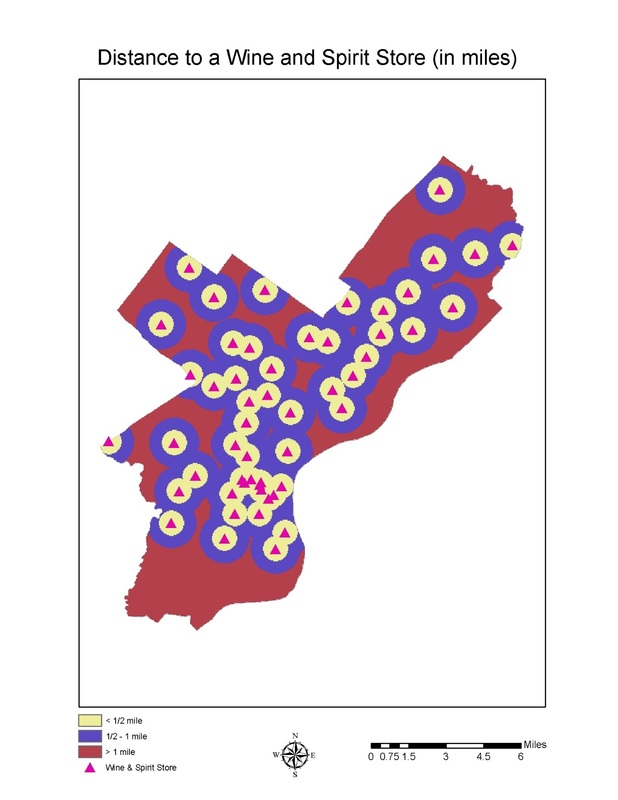
Figure 2. Euclidean distance raster classified into three groups based on distance from a Wine & Spirit store location.
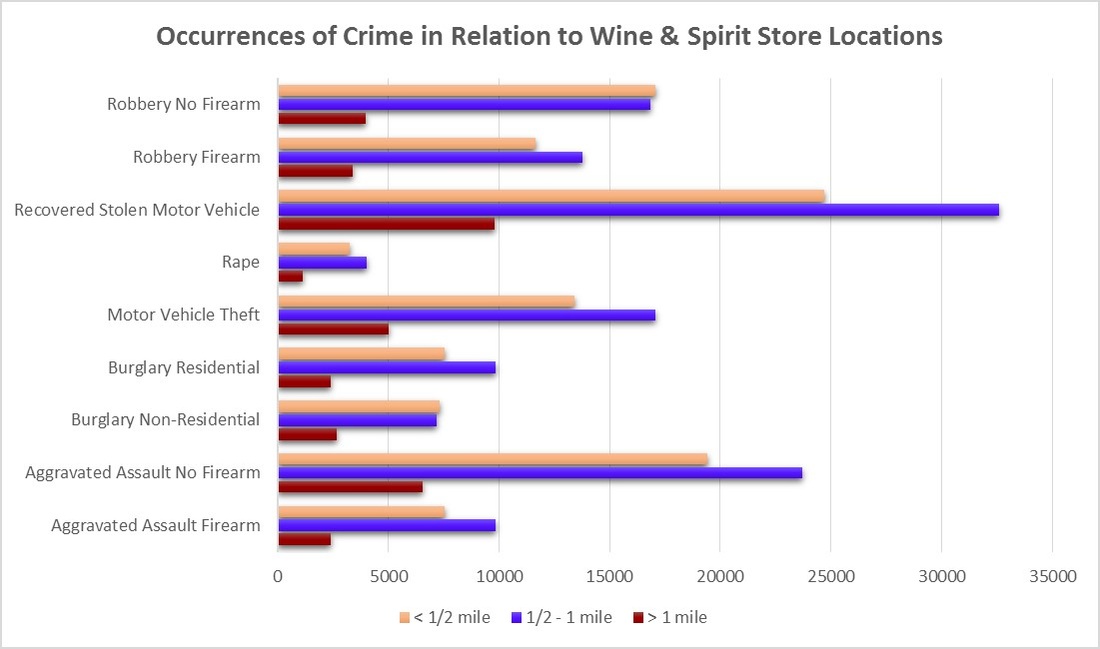
Figure 3. Graph showing the number of crimes (excluding theft and homicides) within a half mile, between a half mile and one mile, and greater than one mile from a Wine & Spirit store in Philadelphia County, PA.
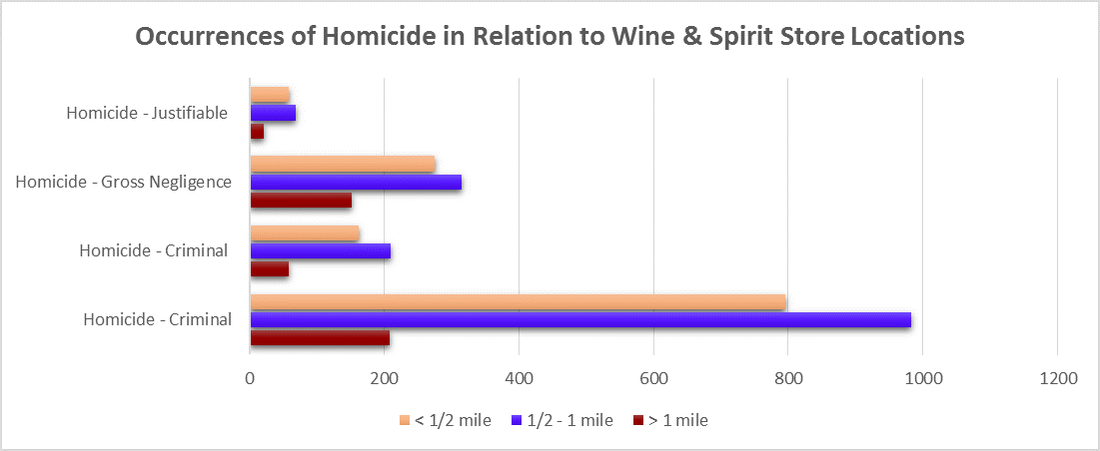
Figure 4. Graph showing the number of homicides occurring within a half mile, between a half mile and one mile, and greater than one mile from a Wine & Spirit store in Philadelphia County, PA.

Figure 5. Graph showing the number of thefts occurring within a half mile, between a half mile and one mile, and greater than one mile from a Wine & Spirit store in Philadelphia County, PA.
